Application of YOLO v2 Object Detection
**All code used have been uploaded to Github**
This is our team assignment about object detection using YOLOv2. In a previous project proposal, we analyzed two available techniques for object detection (R-CNN & YOLOv2). After performance analysis, we finally chose YOLOv2 for detailed exploration. In this report, we will introduce in detail how to develop object detection technology using YOLOv2.
The general outline of this post is as follows:
-
Introduction
-
Flowcharts & Code instructions
-
Performance evaluation
-
Results and Challenges
Tools: Matlab
1.0 Introduction
In the previous Project Requirements and Specifications (Assessment Task 1), we described what object detection is and the availability of our chosen dataset. Through the knowledge we gained in independent reading and lectures, we found two more common object detection technologies and also carried out in-depth descriptions of these two technologies, which are RCNN and YOLO. However, we finally chose the YOLOv2 object detection network for our project. In this report, we will give a detailed description of the code operation instructions, software development process and evaluation methods. At the end we will also discuss the problems and challenges encountered in this project.
2. High level description of the code
2.1 Flowcharts
In this project, the realization of object detection technology is mainly divided into five parts, which are loading the dataset, creating YOLOv2 object detection network, data enhancement, preprocessing the training data, and training the YOLOv2 Object detector.

2.2 Code instructions
2.21 Load Dataset
1) Create Image Labeler
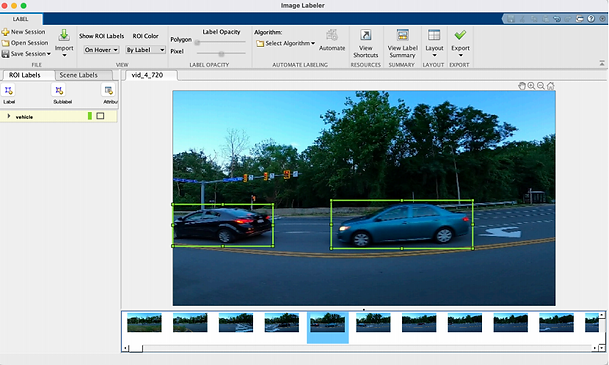
Firstly, we need to use the built-in application Image Labeler in MATLAB to import the training set images and create a label name. As shown in the figure below (refer to Figure 1), we need to manually draw the bounding box of the vehicle to show the position of the vehicle in the image. Finally, export these images with bounding boxes to the workspace as gTruth. The purpose of this step is to let the training set know where the vehicle is and provide a standard "answer" for the training set.

Figure 1 # Entropy calculation function
2) Import Dataset
The next step is to load the data set. As shown in the figure below, the vehicle data is stored in a two-column table. The first column contains the image file path, and the second column contains the vehicle bounding box.

3) Divide Dataset
After loading the data set, we divide the data set into three parts: training set, validation set and test set. Among them, the training set accounts for 60%, the validation set accounts for 10%, and the remaining 30% is the test set.
The rng(0) stands for random number generator which means the generator using a seed of 0. By using the randperm, it will confer an index to the all the data randomly to avoid overfitting.

4) Create datastore
Then, we need to convert the address to a picture, use imageDatastore to get the picture, and boxLabelDatastore to get the bounding box label. Line 23 will give the path to save the training data image, and Line 24 will save the location of the ground frame and its label as a vehicle. In addition, the next few lines of code will play the same role, for validation sets and test sets, respectively.

5) Combine images with bounding boxes
After converting the image path to a picture, the next step is to combine the image and the bounding box together so that they can appear in one picture.

6) Display the training images and bounding box labels
Finally, we can display the training image and its corresponding bounding box label (Refer to Figure 2).

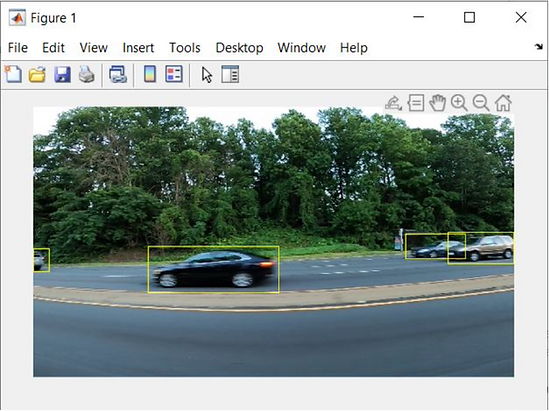
Figure 2# Display the training image and its corresponding bounding box label
2.22 Create YOLO v2 Object Detection Network
1) Define the size and the number of classes
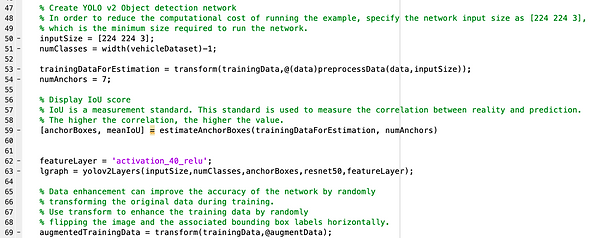
Firstly, in order to reduce the computational cost of training, we set the network input size to [224 224 3], which is the minimum size required to run the network. Then, numClasses function will identify the number of classes of the object by using the number of columns in the table.
2) Evaluate the number of anchor box
Then, the estimateAnchorBoxes will be used to predict the anchor boxes for deep learning object detectors. To accommodate for the resizing of the photographs before training, resize the training data for calculating anchor boxes. Transform the training data first, then define and estimate the number of anchor boxes. Resize the training data to the input image scale of the network using the accompanying function preprocessData. The percent of IoU is a measurement of the true-to-predicted correlation, the stronger the correlation, the higher the number.
3) Define feature layer & Create YOLO v2 Network
Based on the code the feature layer will be defined as the 'activation_40_relu' will be used to instead the layers with the detection subnetwork which can generates down sampled about 16 times. In this case, it can make a balance between spatial resolution and the extracted features' strength. Furthermore, the YOLO v2 Object Detection Network will be create with input size, the number of classes and anchor boxes, feature extraction network, which is resnet50, and the feature layer.
2.23 Data enhancement
1) Increase the training data
Data enhancement improves network accuracy by randomly transforming raw data during training. By using data enhancement, we can add more variations to the training data without increasing the number of labeled training samples.
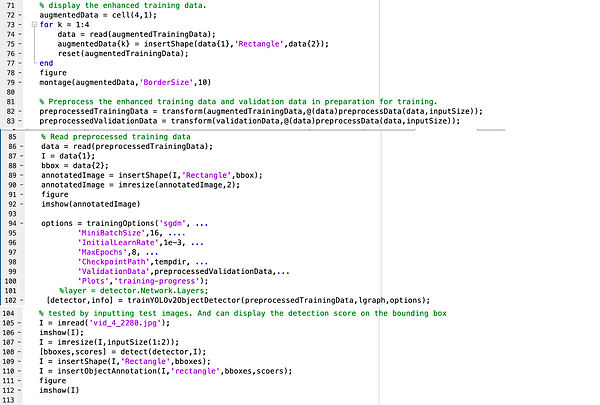
In this part, the transform function will be used to strengthen the training data by randomly rotating the picture and accompanying bounding box labels horizontally which can improve the accuracy of the network at the same time.
2) Display the enhanced images
In this case, a for loop will be used to read the same image multiple times. The following figure displays the image which has been augmented (Refer to Figure 3).

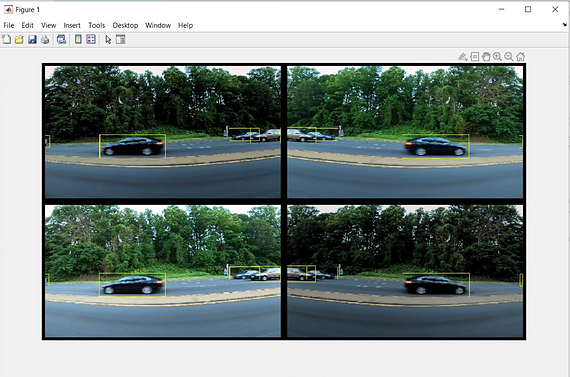
Figure 3# Image enhanced using Transform
2.24 Pre-process training data
1) Pre-process the training and validation data
Use transform function to pre-process both training and validation data, then read the pre-processed data.
2) Display the image with bounding boxes
This part is to display the image after preprocessing (Refer to Figure 4).

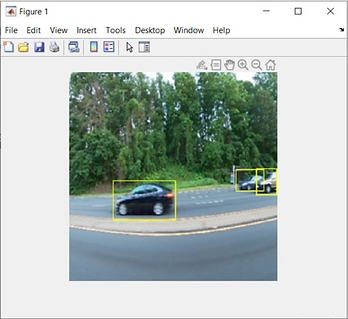
Figure 4# Image after preprocessing
2.25 Training YOLO v2 Object Detector
1) Setup options of the detector
Based on the code, the use of detector trainYOLOv2ObjectDetector function training, training data, the function will use the pretreatment layer diagrams. The resulting page is displayed below (Refer to Figures 5&6).

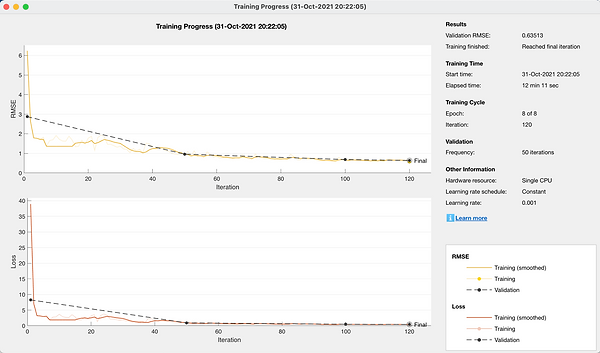
Figure 5 # Training process

Figure 6# Training result information
2) Display the result
After training, this part can be tested by inputting test images, and it also displayed the detection score on the bounding box (Refer to Figure 7).


Figure 7# Object detection test results and detection scores
3.0 Performance Evaluation
The data set we chose to use had a thousand samples. We used 60% of the data set (600 images) for training, 10% for validation, and the rest for testing post-training detectors. However, in the actual operation process, a considerable part of the images in the training set do not exist in the target we need to detect, which undoubtedly has a great impact on our training results.
We used the target detector evaluation feature of the Computer Vision ToolboxTM and evaluated the performance using the accuracy metric, a number provided by the average accuracy that is a combination of the detector's ability to correctly classify (accuracy) and the detector's ability to find all relevant objects (recall rate). The function of drawing PR curve is to show the advantages and disadvantages of performance intuitively. The larger the value, the stronger the performance.
In this project, the accuracy of the model was 0.77.

Figure 8# Average Precision
The value of IoU can also explain the accuracy of our design model to a certain extent. The value of IoU is the result of dividing the overlapping part of the two regions by the collective part of the two regions (Refer to Figure 9).

Figure 9 # The calculation formula of IoU
The red square represents the accurate value, and the green square represents the predicted value, which means that the larger the value of IoU, the more accurate the model (Refer to Figure 10).

Figure 10 # Different levels of IoU
In this project, the average IoU of our model is 0.7634, which is also an acceptable result (Refer to Figure 11).

Figure 11# IoU training results of the training set
In addition, the value of RMSE is a description of the degree of dispersion, and does not represent the pairing error. It can be understood as an assessment of stability. The lower the value, the lower the degree of dispersion and the higher the stability.
The calculation formula is shown below:

The RMSE value of our training project is 0.63513 (Refer to Figure 12). This shows that the degree of dispersion of the project is very low, and the stability of our project is perfect.

Figure 12 # Training process

Figure 13 # Training result information
In general, the PR value and the average IoU value of our detector are both over 0.76, which is a relatively good result, and the RMSE data fully proves that the stable performance of the training program is very excellent. However,if we have more reliable data sets, our performance will be improved a lot.
4.0 Results and Challenges
After we trained the Yolo V2 object detection network, we tested our result structure multiple times with multiple training and validation data sets. By looking at the data set, we believe that the reasons affecting the accuracy of recognition can be roughly divided into the following three types.
-
Speed of vehicle. Too fast speed will cause the target vehicle to be very fuzzy in the image, thus reducing the accuracy of recognition.
-
The number of cars. When there are multiple cars in the picture, as shown in the top right corner of the image, there are three cars in the picture, but only two are identified and one is not.
-
The weather. Too dark a day, such as late afternoon, when the light is dim, can also prevent vehicles from being properly identified.
However, we believe that this is also mainly due to the insufficient number of training sets. Of our 1,000 training sets, only 364 included vehicles and the remaining 636 did not. As a result, the accuracy of vehicle identification in training concentration is greatly reduced.
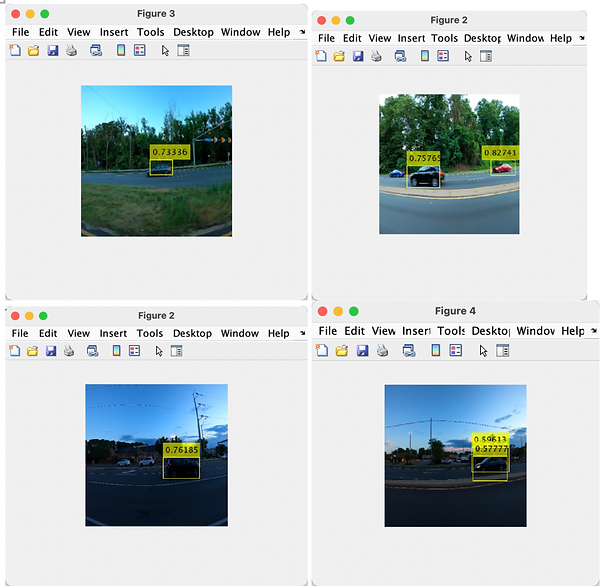
Figure 14 # Vehicle detection results test
In addition, we actually didn't have much of an idea for the code implementation section at first, but we found an example of building a YOLO V2 object detection network on the Math Works website. We analyzed and discussed the examples of the official website, and then applied them to this project step by step. Although there were many technical problems during the testing process, these technical problems were eventually solved well through continuous testing.
5.0 Appendix

